Symposium Attendance
Total number of full paid symposium registrations (blue), number of members within this group (red), and the number of students (yellow) in addition to the full registrations. The total number of papers in the symposium program is also given (aqua)
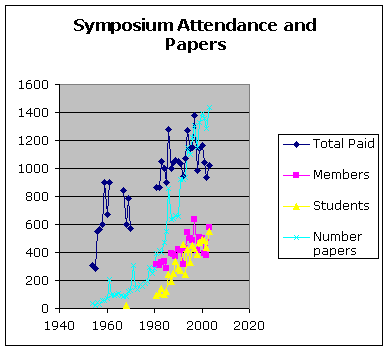
Year
Total Paid
papers
1953
1954
307
33
1955
284
20
1956
549
41
1957
564
28
1958
597
54
1959
900
58
1960
670
72
1961
900
204
1962
94
1963
93
1964
101
1965
104
1966
90
1967
841
84
1968
602
24
84
1969
785
125
1970
573
131
1971
310
1972
153
1973
139
1974
169
1975
158
1976
179
1977
193
1978
291
1979
251
1980
287
1981
862
548
92
395
1982
866
556
104
417
1983
1051
723
145
397
1984
1000
665
102
471
1985
897
609
123
549
1986
1281
246
858
1987
1003
610
194
637
1988
1043
658
252
646
1989
1058
684
338
662
1990
1053
632
284
654
1991
1033
616
274
925
1992
941
630
405
925
1993
1070
642
241
921
1994
1273
731
421
1213
1995
1145
644
332
1098
1996
1150
667
448
1224
1997
1377
741
429
1307
1998
985
573
383
1149
1999
1143
638
468
1330
2000
1166
668
492
1390
2001
1041
650
489
1355
2002
933
555
437
1288
2003
1025
578
549
1432