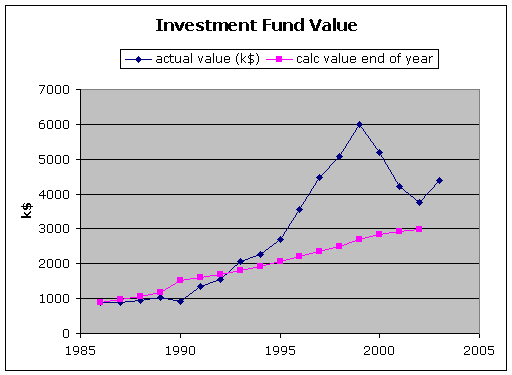
The value of the AVS investment portfolio (blue curve) managed by the Investment Advisory Committee; in 1987, an additional sum of $250,000 was invested through the fund. The growth assuming an average interest rate of 2% above Treasury Bonds is shown (red curve) for comparison; this was the target originally set for the Committee.

actual
calc value
value (k$)
end of year
1986
900
900
1987
895
977.58
1988
957.5
1072.60
1989
1043.88
1170.63
1990
921.681
1523.06
1991
1349
1605.30
1992
1558.30
1685.41
1993
2055.14
1793.95
1994
2254.28
1925.81
1995
2698.77
2058.49
1996
3543.31
2201.77
1997
4474.09
2347.74
1998
5078.71
2501.99
1999
6008.15
2694.64
2000
5205.67
2834.23
2001
4227.36
2936.54
2002
3754.69
2995.27
2003
4399.60